Visualising an Octave in Music
The work researches the nature of the octave in music and how a logical spatial visualisation could be achieved.
The octave, comprised from eight tones from C to for instance C-1 (C, D, E, F, G, A, H, C-1) is first presented as a straight line (drawing right). To schematically visualize the amplification and repetition of tones, each subsequent octave is just lined up in a straight, linear mode. The problem is that, in this scheme, there is no association between every higher tone (for example the tone C and tone of for example C-1 of a higher octave and so on). It seems that in the linear drawing, the tones just rise, without the notion of having basically the same tone repeated but for an octave higher.
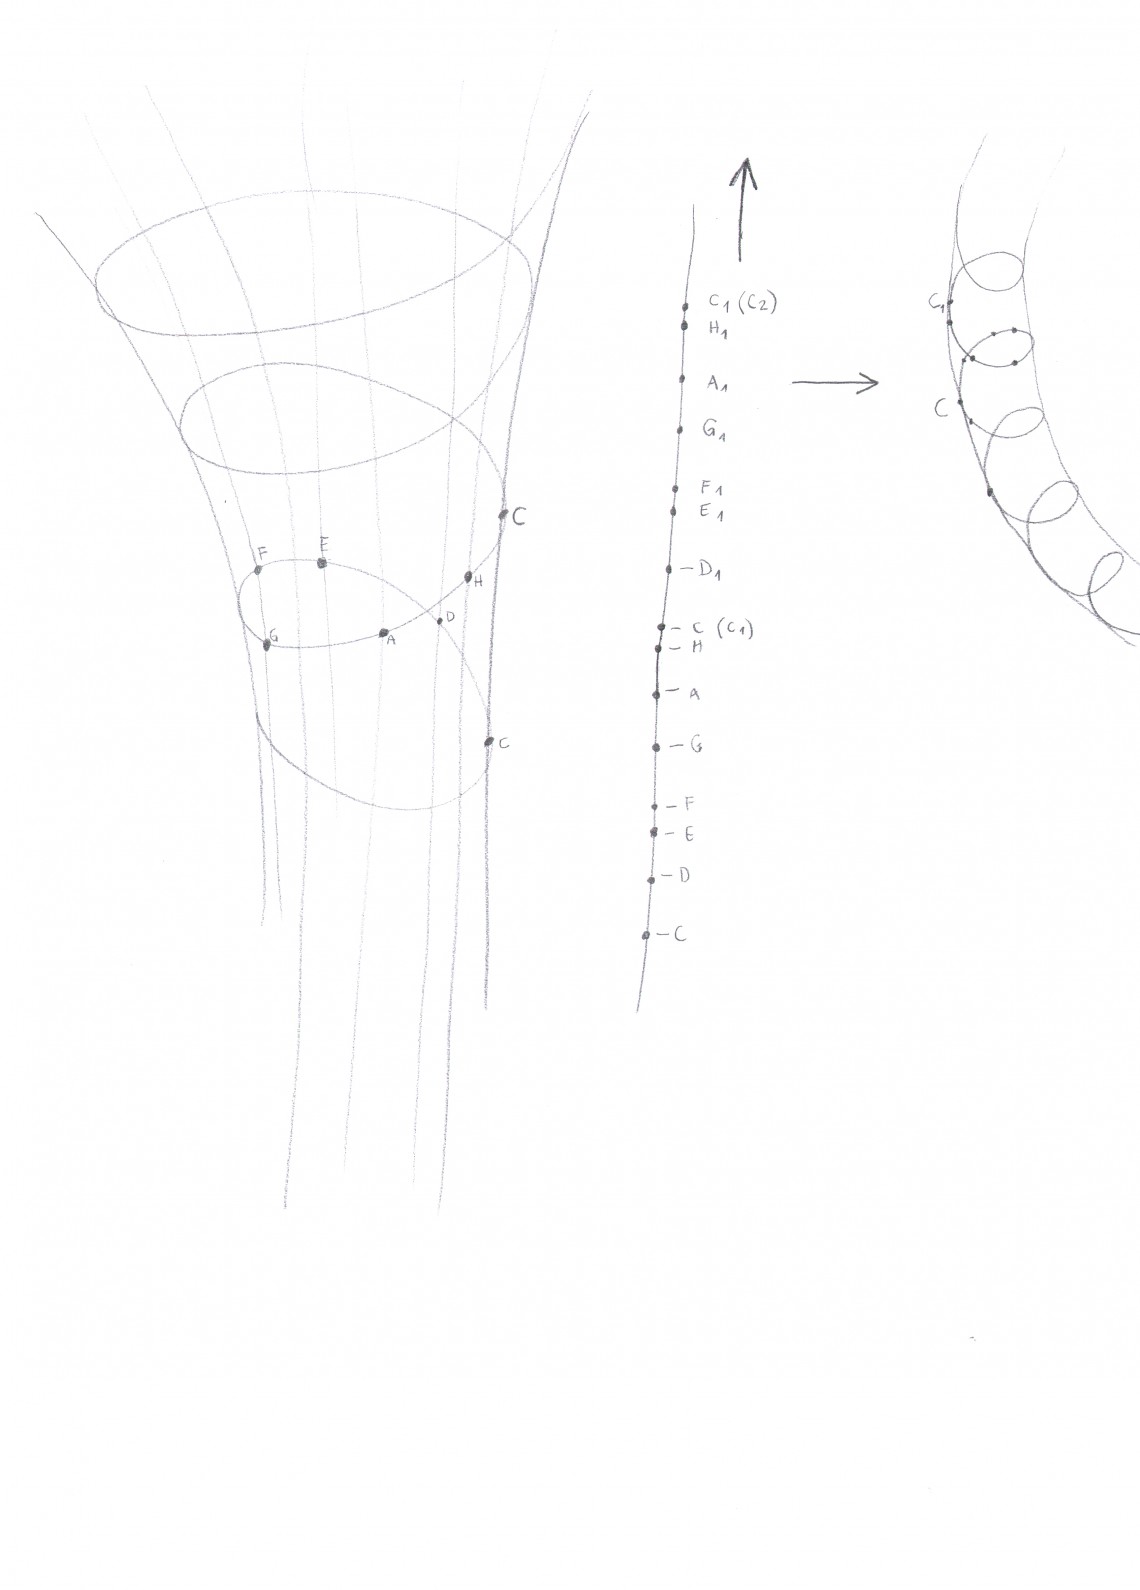
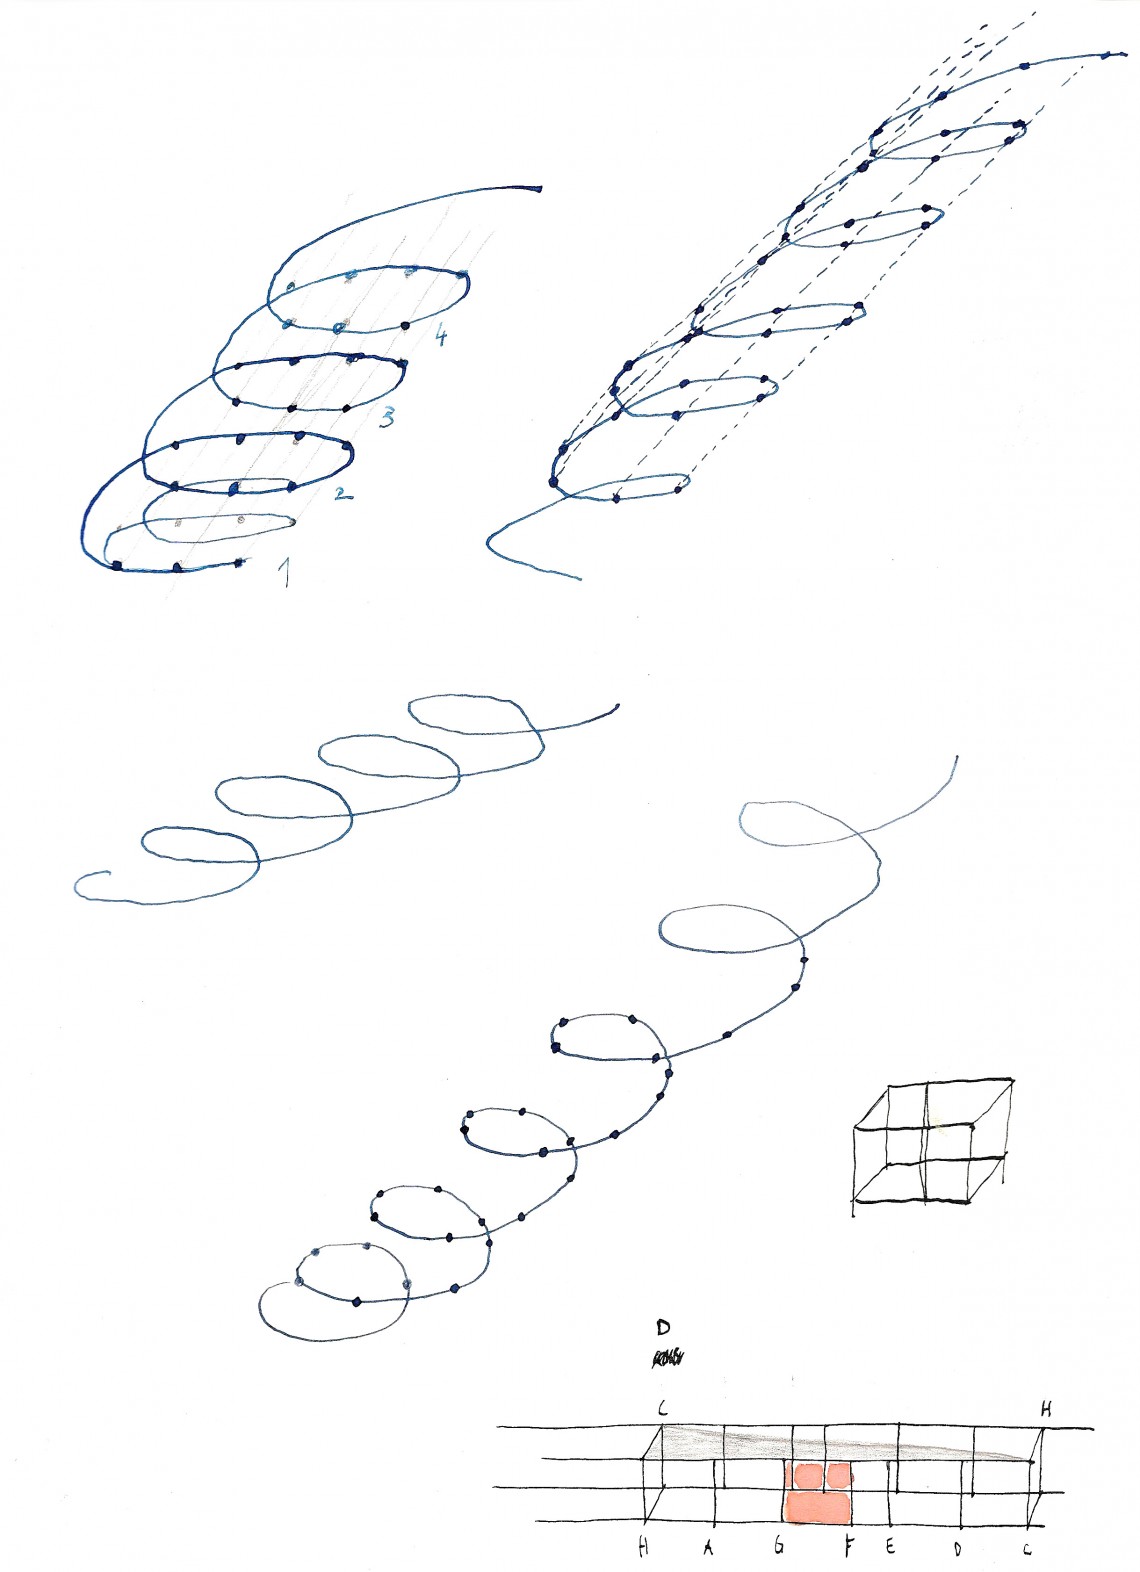
This problem can be solved if the initial straight line is bent into a spatial form. The spatial form that will answer the problem concerning the association of the same tone would be exactly the shape of a spiral. And not just a linear spiral, but a spiral going around the shape of another spiral. In the spiral form, the same tone but of a higher octave, is repeated just above it. The same rule applies for each and every tone in the octave (D with D-1, E with E-1 etc.).


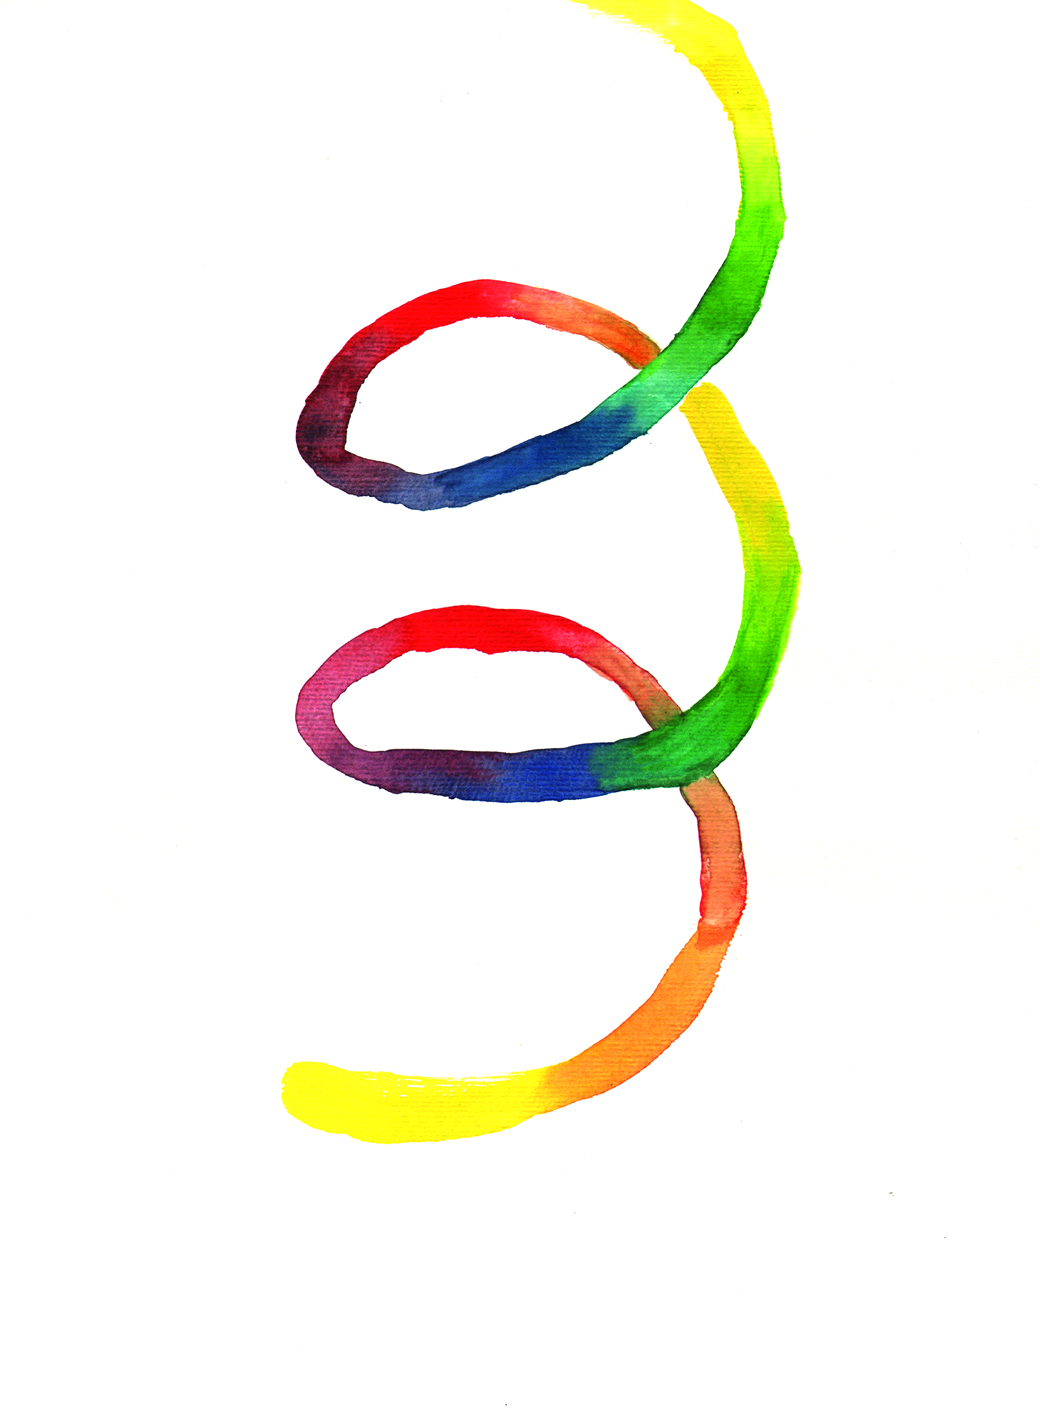
I used different techniques to research this idea so far, from pencil drawings, aquarelles that add to colour visualizations concerning the octave to a representation made out of copper wire. The work was made trying to follow the mathematics behind the octave as much as possible and create a viable visualisation.


I started work on this project in 2009 and it has been an off-and-on project since then. The work will continue in the hope of finding suitable partners for the research and create interactive 3D graphics and further explore the possible applications.